Contents
- 2.1 Important Physical Constants
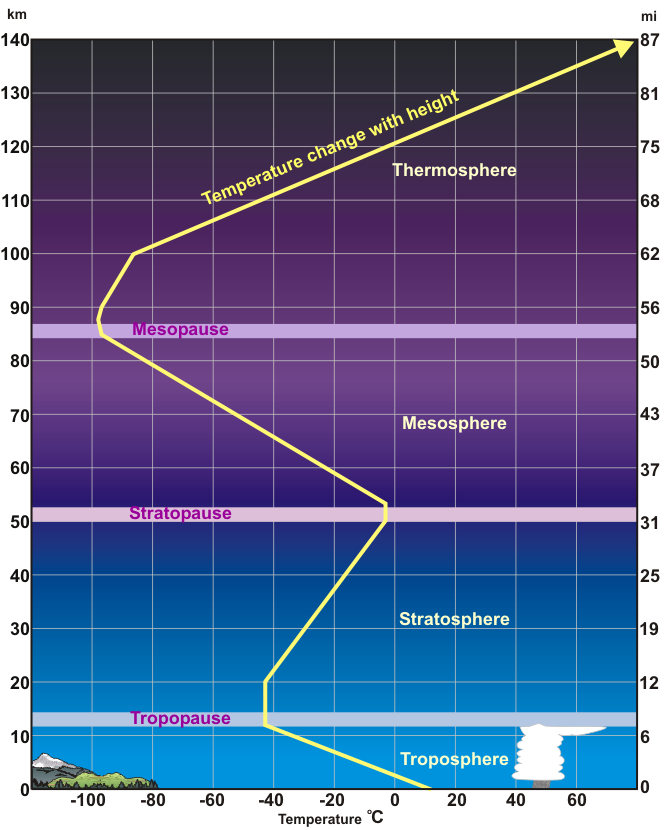
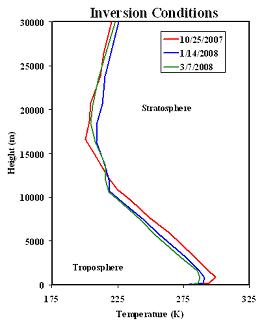
- 2.2 Temperature Structure of the Atmosphere
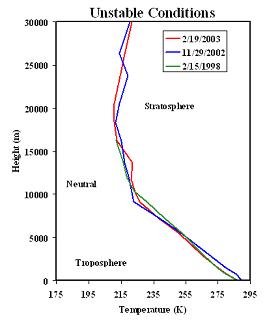
- 2.3 Temperature Patterns of the Lower Atmosphere
- 2.4 Diurnal Patterns in Air Temperature
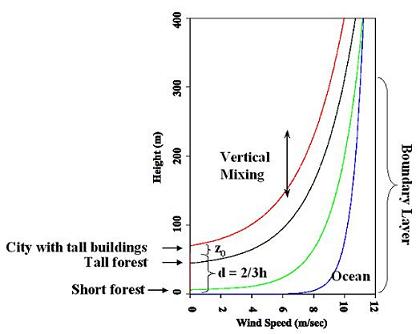
- 2.5 The Planetary Boundary Layer
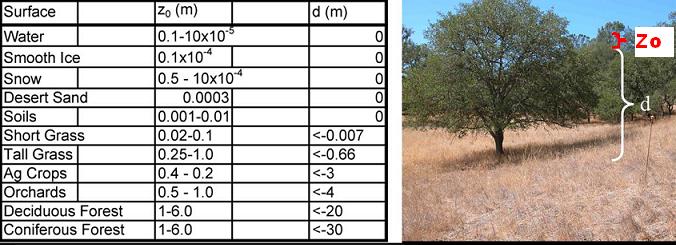
- 2.6 Typical Aerodynamic Constants
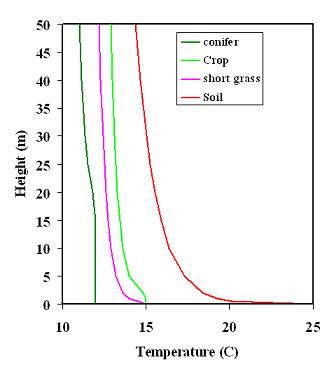
- 2.7 Modeled Vertical Temperature Patterns
- 2.8 Aerodynamic Surface Temperature and Radiometer Measurement
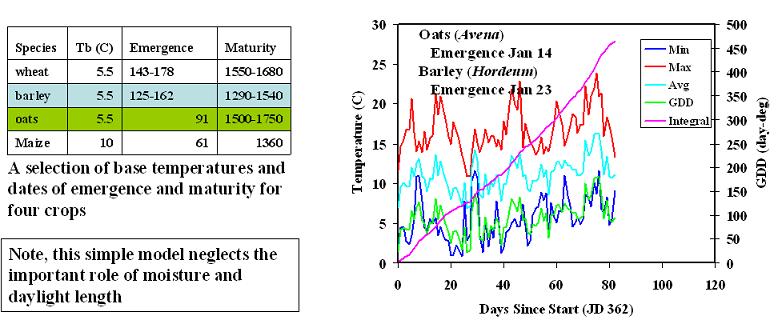
- 2.9 Growing Degree Days (Thermal Time)
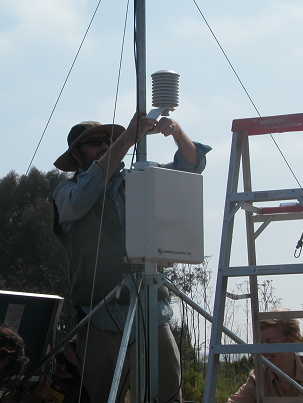
Installing Temperature & Relative Humidity Sensor at Coal Oil Point;
Photo by Meri Marsh; May 25, 2007


